20080830 - EURPLN

I just love the market - whenever I'm sure of something (this post), the market does something opposite. Forex will quickly cure everyone of high self-esteem. Take a look at EURPLN:


It's too early to say, that EURPLN has broken out from a channel, nevertheless it looks surprising. RSI does give us the negative divergence (trend breakout), however short-term trend is upward (higher-low, higher-high pattern).

20080829

The WIG Index is market has broken the long-term line, nevertheless it was not confirmed yet in any way:


The WIG20 Index clearly broken-out from a downward channel, but remember WIG20 Index tends to overreact:


Please note the nice positive divergences on both indexes - they can be the key to current situation. Nevertheless, on intraday basics the wide market looks really messy:


The downtrend looks it has been broken (without confirmation yet). However, the current price draft can become the double tops or reversed shoulder-head-shoulder easily. Thus, stay focused, but do not do anything yet.

20080825

Not much to say. Both indexes are still in downtrend channel:


Small trend breaks can be noticed in oscillators, but it really gives no clues about future market moves.

The polish unemployment hit its record high (20.4%) in Sep, 2002. Since then has been continuously dropping to today's level of 7.3%. The EU accession in May 2004 just seeded-up this process. However, the main reason for the drop is not domestic job creation, but the huge Pollens emigration, mainly to Germany, UK and Ireland (Wikipedia).


Lack of domestic specialists, caused the prices for services to go up and therefore the GDP was increased as well. Huge inflation is a problem, however the energy, food and gas prices were shielded with strong uptrend of polish currency (i.e.: EURPLN, USDPLN, GBPPLN).
Can Poland continue with such a strong economy? Probably no, but I don't expect the same level of economy slowndown as in Europe. Really good article can be found here (I seriously encourage to read it).

Please note:
This is the last chart in this week, as I'm going abroad for the rest of the week. Nevertheless, I will try to chart Friday session at the end of weekend.


Sources:
[http://news.bbc.co.uk/2/hi/business/1834336.stm]
[http://globaleconomydoesmatter.blogspot.com/2007/10/employment-and-unemployment-in-poland.html]

20080822

The WIG Index still has some place for upward move:


The WIG20 Index is still in the channel, but considering the small volume, it can easily break from it:


The US market close confused the most of technicals traders (here). There seems to be potential for upward move, but I think there will be some level of uncertainty at next session.

The polish market is also giving the mixed signals. After US close, we shall expect high open at polish market at Monday (covering the gaps), but volatility and small volume together can make miracles.

The EURPLN has broken the short-term uptrend line and we will rather expect it to continue downwards now (chart thanks to ChartStation):

20080821

The WIG Index is still in a short-term channel:


The WIG20 also moves inside a channel, but we are getting closer to "psychological" level of 2500:


It's again hard to tell if the market continues. Market is in downtrend, but it did not cross the low from Jun yet. What is interesting - indicators (RSI and CCI) are confirming the trend, but the volume does not.

Fibonacci retracement from Jun low to Jun high still calls this move just a correction (below 61.8%), but it can change in few sessions. Nevertheless, it's still not the best time to do anything on the market:


Time to Avoid the Stock Markets Altogether from EnzioClock - this paper goes straight to the point. It's hard not to agree, but it is also perfect time for observations.
There is no mystery - when wide market is going down, everything more or less tends to go down - we don't like fighting the trend. But some stocks are obviously stronger than others; maybe strong hands are involved, fund manager is stubborn or corporate is buying back - we don't know and probably we will never known.
Nevertheless, we can try to spot those stocks with Relative Strength indicator. As for US market it seems Health Care and Consumer Staples sectors are doing much better than the market in general (here). As for polish market, take a look at Telekomunikacja Polska S.A. (TPS) and check its relative strength here (polish, but just click on "Sila Relatywna" button to see proper chart). Its looks good and behaves much better than the wide market. Another strong bets are CEZ (CEZ) or PKOBP (PKO). The bear market will be eventually over someday. It seems to be a good idea to have a list of those "behaving" companies prepared then.

Sources:
[http://seekingalpha.com/article/91728-time-to-avoid-the-stock-markets-altogether]
[http://seekingalpha.com/article/91761-s-p-500-key-sector-relative-strength]
[http://www.czasnazysk.pl]
[http://www.czasnazysk.pl/kategoria/edukacja/lekcja-4_24 (via Google Language Tools)]

20080820

The WIG Index continues downtrend from yesterday:


The WIG20 Index is heading towards important level of 2500:


After triange breakout, the wide market is now in channel, which we can see on 30-min intraday chart (thanks to Stooq). The RSI seems to confirm the downtrend:


We are at the channel lower line, therefore I will expect a small rise tomorrow. The market is clearly in short-term downtrend now and we are not taking any position there.

Gold. 79th atomic number in Periodic Table, symbol Au (Latin aurum). Nice shining yellow metal with interesting physical properties. In the past, gold was the reason for many wars, betrayals, killings and breakups. One of the best-known gold rushes was that of the Klondike Gold Rush in 1897–99 with largest mobilization of goldseekers in history. Gold is also symbol of richest. Every lady needs a gold jewelry (or at least she thinks she needs). Aside from jewelry, the gold has its use in industry (electronics, dentistry, medical, glassmaking, etc.) and, of course, in financial system.

Gold is also referred as good investment tool for bad times. The gold uptrend started in 2001 (does it sound familiar to the year 2001 from this post?), let's see the big picture on chart then (thanks to ChartStation from NetDania):


It seems we are getting closer to 38.2% Fibo retracement level (ca.750 USD) and also to uptrend line (since half of 2005) - that could be next stop. Nevertheless, in the last couple of weeks gold lost about 20% of value and that's pretty much. Obviously, it's no longer higher-high, higher-low pattern and we can also see small support break on RSI oscillator (it was between ca.90-34 for 8 years). Therefore I will say that getting in Gold at this level is risky.

Sources:
[http://www.dwagrosze.blogspot.com (polish)]
[http://en.wikipedia.org/wiki/Gold]
[http://goldandsilverstars.blogspot.com/2007/10/goodness-from-bad-times.html]
[http://geology.com/minerals/gold/uses-of-gold.shtml]

20080819

The WIG Index's intraday triangle has failed today (see this post update) and the breakout had high volume:


The WIG20 Index is now below lower trendline:


The breakout from this formation is a strong sell signal indeed. On short-term we can also see lower-low lower-high pattern. The today's gaps will act as a resistance now.

Downtrends on indicators (CCI and RSI) also seem to confirm the direction of the market.

However, it does not negate yet the whole bullish medium-term race. I'm personally bearish, but until we see the WIG Index below 37300 (low from Jun), we cannot say long-term downtrend continues.

Make sure you watch today's video from Alphatrends - few important trendlines and supports have been broken. Brian Shannon does not give us positive view on the US market in general.

Sources:
[http://pl.youtube.com/watch?v=foPsPFI5E30]

20080818

The WIG Index continues below downtrend line, but we can see the triangle formation (from this post) and it looks pretty interesting - let's see how the situation will develop further:


The WIG20 Index is catched between those trendlines:


Again, not much can be told about the market. In current situation cash is the king.

The mBank, an online polish bank gained its popularity mainly due to fee-free access to a number of polish mutual funds and open politics (i.e.: very easy creation of an account). The mBank (which is a really good bank anyway) also publishes (here) a nice chart with the percentage share of all the money invested by its clients in the four kinds of funds:


The stock funds lost already ca.30-40% in value (yearly ROI, can be checked here). The 40% drop in the WIG Index resulted in just one person out of seven withdrawing their money from stock fund and still more than a half of all the money is invested aggressively in stocks. It seems, the Polens are still very optimistic about the market in general.

Update from 19/08/2008:
It seems that intraday triangle formation has failed today (thanks to Stooq for chart):


Sources:
[http://www.mbank.pl/indywidualny/inwestycje/sfi/aktywa.html]
[http://www.mbank.pl/indywidualny/inwestycje/sfi/notowania/]

20080816 - EURPLN

Since our last post EURPLN managed to break the resistance line, therefore the analysis needs to be updated as well. The EURPLN is in downtrend - that goes without a question. However, the channel should be now plotted like this:


In 4-hour chart we can see the double bottom with the realized target to ca. 3.3360:


I don't think the EURPLN rally will continue higher than ca.3.35. But in case it does - that's the market and the best we can do is just to observe it and react if needed.

20080814

The WIG Index continues just below downtrend line, but cannot cross it:


The WIG20 Index attacked a Jan's low today but closed below:


This situation can result in both directions, therefore we will just watch it. Brian Shannon from AlphaTrends is much more more optimistic about the US market then I about WSE. If he's right, there is not much to say - the world of finance will go after US indexes without asking too much.
The intraday the WIG Index chart looks interesting (thanks to Stooq):


The possible formation there is Triangle, Symmetrical Bottoms (formation 40, Encyclopedia Of Chart Patterns, T.N.Bulkowski), which is a continuation pattern. Nevertheless, please remember, triangles are not the most reliable formations (also the intraday formations tend to fail more often than those in wider timeframes). However, once a breakout occurs, the prices tend to keep going. For statistics check the Encyclopedia.

The polish mutual funds sold stocks in Jun (record high 48,28% of all transactions' information), but the situation stabilized now and in Jul only 27,59% of total transactions were sells (after Holder news here (polish)):


In comparison to the monthly WIG index it could mean that mutual funds would be selling on tops (trying to get best prices) now, pressing the market down.

Sources:
[http://stooq.pl/q/a/?s=wig]
[http://www.holder.com.pl/fm.shtml?id=4138&fm=11154&c=33951744012 (polish)]
[http://alphatrends.blogspot.com/2008/08/stock-market-video-trend-analysis-81408.html]

20080813

The WIG Index is rebouncing from the downtrend:


The WIG20 Index closed below Jan's low:


The US closed more or less neutral, therefore I assume the wide market will continue moving down. Nevertheless, I will not trust any forecast, as under current circumstances the trend can reverse in just few sessions.

Foreign investors are very interested in one polish asset - currency. Polish zloty (PLN) is in a very strong uptrend for a couple of years. Rising interest rates, EU injections, immigrants sending (and converting) foreign currencies, strong polish economy - all of those have brought PLN to its top.
Take a look at EURPLN 300-days chart (thanks to ChartStation):


The EURPLN moves in a channel, right now we are near it upper line. Also the RSI is worth noticing, as it could not cross RSI 70 for a year now.
Interest rates are expected to rise 25-50 points in this year, therefore the EURPLN rally should continue.

Note - oil reached its target profit, I will consider closing some of the oil shorts from this post.

Update from 16/08/2008:
It seems the EURPLN crossed the resistance line from the channel above (and what's interesting also RSI crossed 70). Therefore the analysis has been updated - please check this post.

Sources:
[http://biznes.onet.pl/0,1802960,wiadomosci.html (via Google Language Tools)]
[http://biznes.onet.pl/0,1797836,wiadomosci.html (via Google Language Tools)]
[http://stooq.com/q/?s=eurpln&c=5y&t=l&a=lg&b=1]

20080812

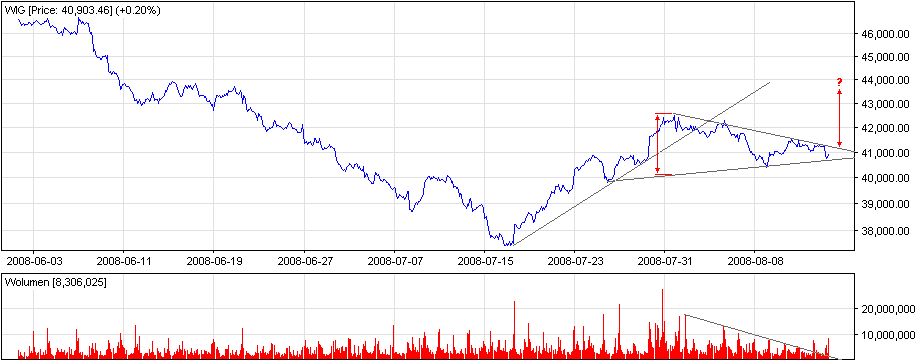
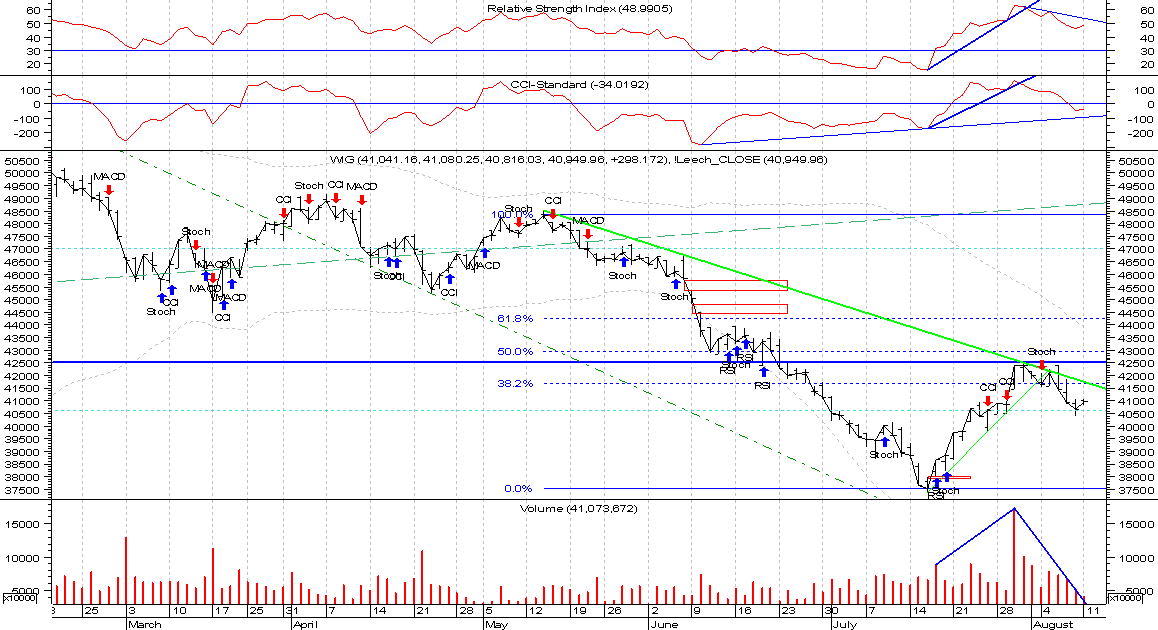
The WIG Index rallied again to downtrend line:


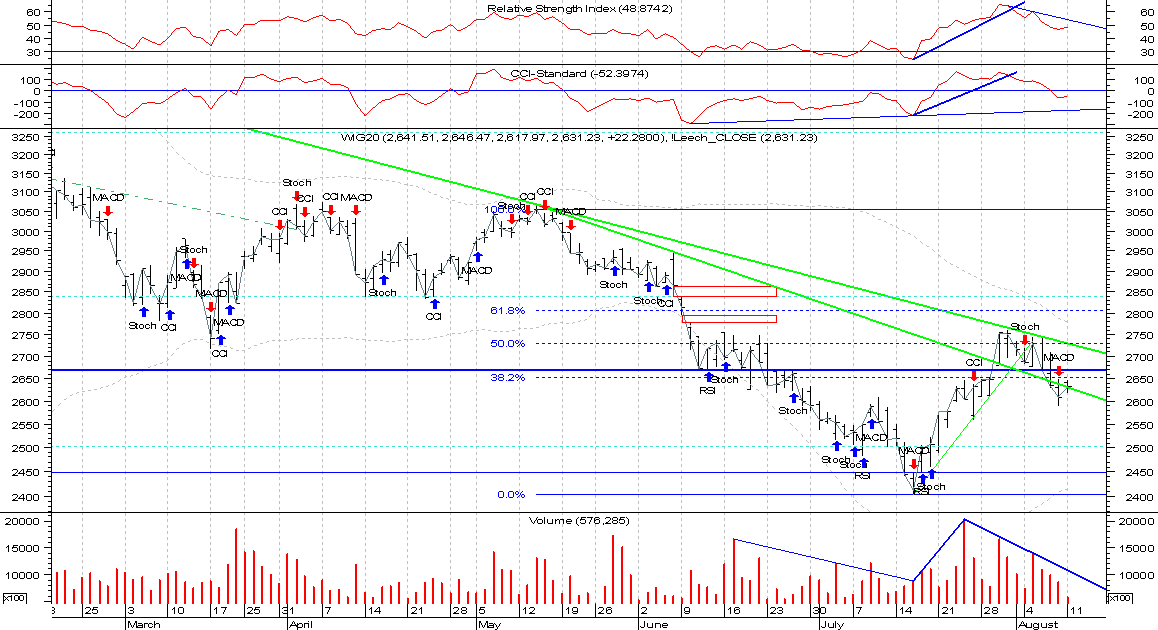
The WIG20 closed a little above the Jan low:


Now we have a chance to break through the downtrend line. The wide market is testing this line 4th time - that gives us some clues about market strength, but the next few sessions can be really important. General situation is still not clear; negative close in US will not help the market, also the RSI/CCI are showing downtrend. The move today was surprising and I think we should expect this kind of volatility in the future as well. The best course of action is to wait until market sets direction and join the confirmed trend then.

Why the current situation in US housing is called a bubble? Simply because it looks like a bubble.
Take a look at Miami Home Price Index (thanks to Data360 portal):


Charts for Chicago, Boston, Detroit, Phoenix and few other cities looks distressfully similar (for full report go here).
Why it's so important? There is a number of articles in Internet (for example here (take a look at references section), here, here or here) explaining the general economy impact of failing home prices (and also owners' credit capabilities), consequences of NINJA credits (No Income, No Job & Assets) or incoming ARM resets. Another good idea is to read Q2 2008 Fannie Mae Investor/Analyst Conference Call Transcript (pages 3-8 and discussion on Alt-A mortgages are interesting).

It's a very complicated topic, hard to fully understand. I like more imaginable approach:
"Think of consumer spending power as a big pond, with a stream - consumers' personal income - flowing in from above, and another stream - consumer spending itself - flowing out from the bottom. Every now and then, the pond (personal wealth) gets higher or lower from rain (higher stock prices or home values). However, the flow from the lower end always results for the most part from inflow from the stream above."
Ahead of The Curve, J.H. Ellis

Now think of that - will you spend more money on consumption or investment, when your personal pond is getting more and more dry?
Nevertheless, don't get too pessimistic. US has very big and self-sufficient economy; mortgage and stock markets are just the most visible (beacuse you can count them) part of it.

Sources:
[http://online.wsj.com/article/SB121805947661818327.html?mod=djemRealEstate]
[http://seekingalpha.com/article/90265-the-mortgage-crisis-brings-unexpected-neighbors]
[http://www.salon.com/tech/htww/2008/03/28/the_arm_reset_crisis/]

20080811

The WIG Index is almost exactly on Fibo 50% of the whole main uptrend (since 2003), nevertheless market is still below medium-trend downtrend:


The WIG20 Index is precisely below 38.2% Fibo of this correction. RSI and CCI oscillators are in downtrend:


Not much can be said about current situation - both directions are still possible. To me it seems the market is weak again, but charts are not really telling anything right now. Nevertheless, the US indexes have broken quite strong support (check for today's Alpha Trends analysis),

First hostile takeover on WSE has backfired as the W.Kruk, owner of Kruk (WSE:KRK) jeweller company managed to buy controlling packet of shares of the Wolczanka&Vistula company. Here you can find interview with W.Kruk (translated by Google Language Tools - understandable, but not perfect translation, for original look here (polish)). It is the classical example of Pac-Man Defence, when a company that is under a hostile takeover acquires its would-be buyer. For animated (and funny) explanation check this YouTube video.


Conclusion - do not attempt to takeover the family company with determined owner, especially when you have quite high Free-Float by yourself.

Congratulations to W.Kruk for successful defence! If taking long positions in bear market were not against my rules, I would buy some of Kruk shares for sure.

Sources:
[http://www.reuters.com/article/rbssConsumerGoodsAndRetailNews/idUSL2672086120080526]
[http://www.alacrastore.com/company-snapshot/Vistula_Wolczanka_S_A-2110875]
[http://www.investopedia.com/terms/p/pac-man-defense.asp]
[http://pl.youtube.com/watch?v=Y9Sg4QnMKKw]
[http://www.officialchad.com/index.php/chad/games/]

20080808

After touching the Jan's low, the WIG Index continues the move to the south:


The WIG20 Index closed below lower downtrend line:


It's no longer lower-low lower-high pattern and current mixing signals (like today's very high close in US) make the situation even more unclear. I'm assuming market will rather continue downtrend; nevertheless, we should not follow our feelings, but what we see on charts.

The stock market has been never easy. When technical analysis tells us nothing, maybe it's time to get familiar with other forecasting techniques. I'm not a big fan of The Elliott Wave Theory, but The Business Cycle theories are quite interesting and whatsoever they were positively verified over last centuries. In short - the economic cycles involve shifts over time between periods of prosperity and periods of recession. Take a look at The Kondratieff Theory (after AppFunds blog) for example.
The picture below (shamelessly stolen from BigPicture blog, originally created by M.Blackman) summarizes the concept pretty well:


The Economic Cycles theories are not accurate, it is hard to time the market just by them. Nevertheless, they are giving us general overview in which stage we are. I believe we are somewhere between Late Expansion and Early Contraction: stocks are down, bonds worldwide are somewhat killed by high inflation (polish bonds are exception due to high interest rates and rising value of PLN - they are very good investment for foreign investors now), but commodities are still strong - just take a look at Oil, Silver, Gold, Sugar, Cocoa, Coffe, Orange Juice or Soybeans (more of futures here).
According to theory we should now expect a downtrend in commodities and then wait for rally in bonds. The economic cycles theory has proven its value, but remember the trader has to be flexible and keep watching charts.

Sources:
[http://www.kwaves.com/kond_overview.htm]
[http://futures.tradingcharts.com]
[http://bigpicture.typepad.com/comments/2006/09/the_economic_cy.html]

20080807

The WIG Index covered the gap from end of Jan. Situation is interesting, but I don't think it will clarify anytime soon - it still can be either main trend reversal or continuation from main downtrend (which is more likely). Until index makes lower low (below 37k) or breaks Jan low (and then rallies to at least 45k) we should just observe - you are always on disadvantage when investing in bear market:


Looks like the WIG20 Index overreacted in comparsion to wide market. Today's close on downtrend line still gives us hope for rebounce. The US closed on red, therefore is rather little chance for positive close in WSE. Market right now is more like roller-caster and all scenarios are possible here:


A few words on oil or rather "The Oil". Everything is driven by oil. No nowadays economy can survive without it. No market analysis can be complete without oil contracts, especially with current market sentiment.
The current highest cost of extracting petroleum is ca.40 USD per barrel from bitumen in Canada; therefore we put aside Peak Oil theory and we focus just on charts. Thanks to ChartStation, very nice tool from NetDania, we can track Brent Crude Futures:


Petroleum futures are going down fast. Nevertheless, the price hasn't even touched the 38.2% Fibonacci retracement level. The next possible stop seems to be about 110 USD, with the medium-term line, 38.2% Fibo and 200-day moving average (after the Fallon Stock Picks blog).
As for now oil is just in correction and charts do not leave us much hope for cheap flights yet. I will warmly welcome any price reduction in price of petroleum as our life expenses somewhat depends on it.

Small update (14/08/2008):
Over the 2 years there was no measurable correlation between oil and equities. Thus, statistically speaking, we shall not expect rally (if anything) in stocks when the oil goes down.
Surprised? For detailed explanation take a look here or here.

Sources:
[http://ffden-2.phys.uaf.edu/102spring2002_web_projects/M.Sexton/]
[http://blog.fallondpicks.com/2006/09/market-cycles.html]
[http://blog.fallondpicks.com/2008/08/oil-set-for-200-day-ma.html]
[http://seekingalpha.com/article/90865-just-how-correlated-are-oil-and-equities]

20080806

Today was an interesting session. The WIG Index opened above the medium-term downtrend, but just below the low from Jan. The gap from end of Jan acted as support thought:


The WIG20 Index also looks interesting. The Jan low together with end o Jun gap seem to be pretty strong support now:


Next few sessions could be deciding. The good news are green close in US, nevertheless the serious problems in finance sector render this situation very confusing. From technical analysis point of view, the long-term trend is still down, however from medium-term perspective there is no longer downtrend.

It seems Jun has been good month for polish mutual funds. The funds investing in Warsaw Stock Exchange stocks performed much better (+0,79% on avg.), than their counterparts funds investing in foreign stocks (-4,96% on avg.). Of course, the poor performance of polish funds buying foreign stocks is mostly caused by very strong uptrend of polish zloty (PLNEUR). Currencies do really matter.

Nevertheless, the best results were produced by sustainable investment funds (+1,88% on avg.) and bonds funds (+1,47% on avg.) - that shows us, that we should not invest aggressively under current market circumstances. The short summarization can be found here.

Sources:
[http://pb.pl/images/files/2008/08/4104b172-9e0d-4002-8181-1344ecf44ff6.pdf]
[http://finance.yahoo.com/echarts?s=PLNEUR=X]

20080805

The WIG Index has broken the uptrend line and is still below long-term downtrend line:


The WIG20 Index has similar situation:


The situation does not look so bullish as before, nevertheless there is still gap from end of Jun, which will probably act as resistance. Very high close from US should show the direction for tomorrow.
Warren Buffett said in one of his letters to Berkshire Hathaway's shareholders: $2 billion daily of force-fed dollars to the rest of the world may produce global indigestion. Nevertheless, it helps to close the trade deficit as it makes American exports cheaper. Or does it really?
Below is a US trade deficit and EURUSD on the same chart:


As for the period 1971-2001 it worked fine: USD was rising - trade deficit was lowering; and vice versa. (It seems that EURUSD is leading indicator there). However, since 2001 the EURUSD has been rising AND the US trade deficit has been rising.

Sources:
[http://www.census.gov/foreign-trade/statistics/historical/gands.txt]
[http://www.berkshirehathaway.com/letters/2007ltr.pdf]
[http://www.npr.org/templates/story/story.php?storyId=14901181]
[http://www.rte.ie/business/2008/0509/usa.html]