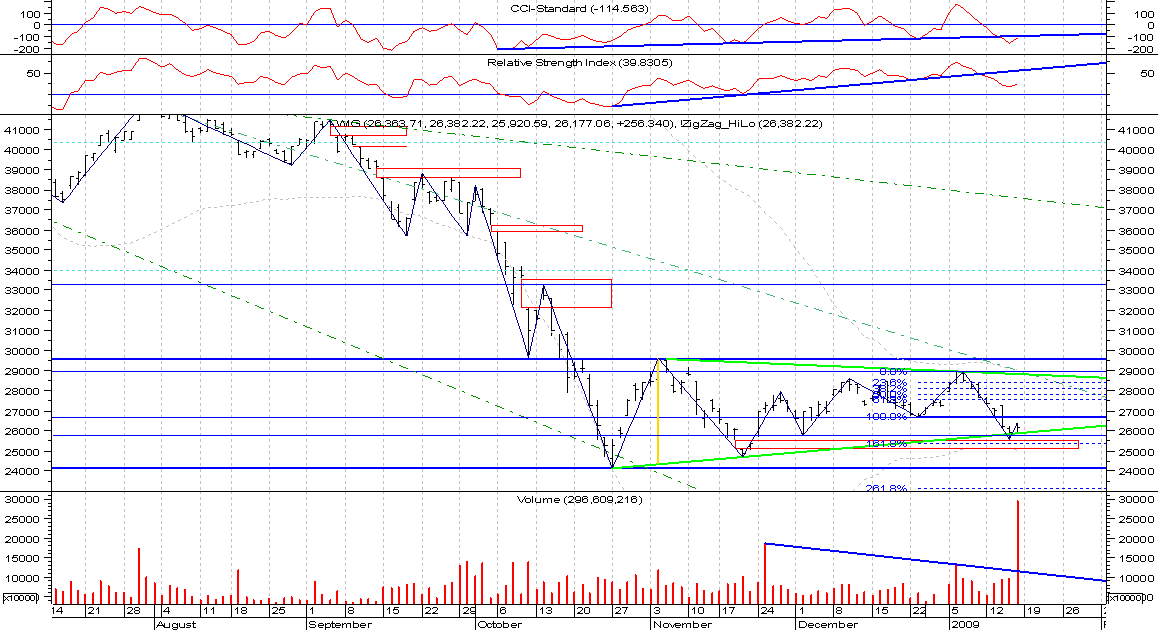
I don't know how to interpret this big volume. Right now it looks the index bounced from trendline (and also from gap), however the RSI and CCI are suggesting south direction rather. Break of last high also suggest continuation of downtrend, at least on daily basics.
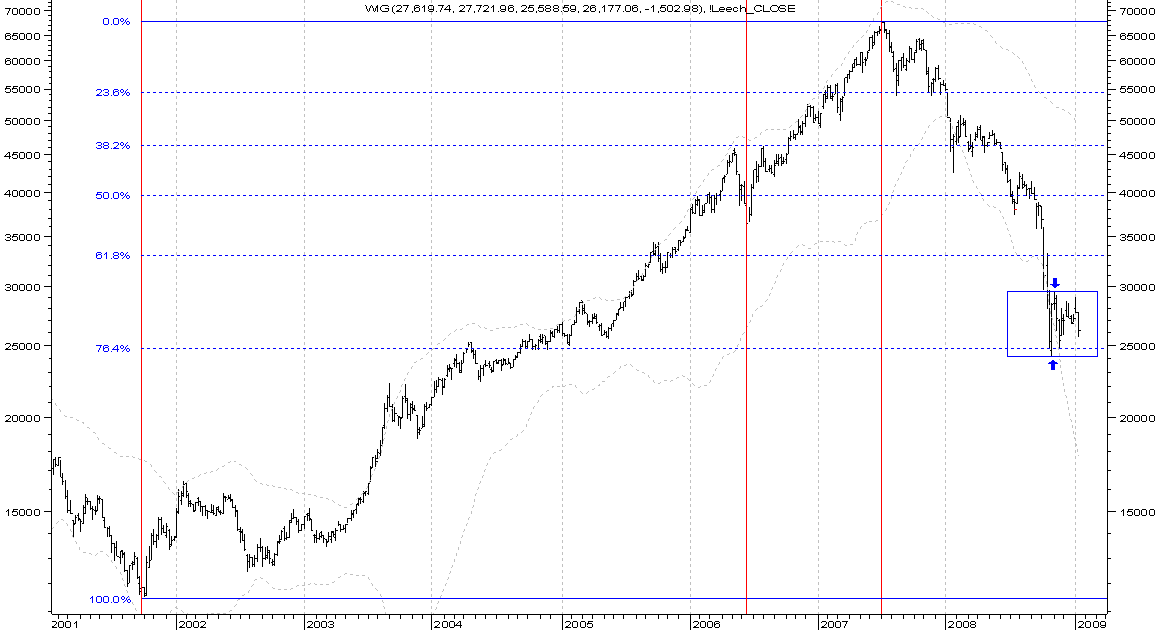
Generally speaking, the market gives mixed clues. It's hard not to get impression (it's subjective), that market is recovering. Nevertheless, charts are not suggesting to take any long positions yet. The chart still looks bearish in wider timeframe:

Brian's video for today here.
A rather interesting article about leveraged ETF funds (here).
Sources:
[http://online.barrons.com/article/SB123155505487470527.html]


No comments:
Post a Comment